
UV-Vis spectroscopic measurements consist one of the most widely used methods for protein quantification. This is due to the fact that the tryptophan and tyrosine (and to a lesser extent the phenylalanine) residues of proteins strongly absorb at 280 nm. Hence, the corresponding absorbance is used for the calculation of protein concentration, based on specific quantification formulas. If the protein sample does not have tryptophan or tyrosine, the concentration can still be easily measured by the absorption at 205 nm in which the peptide bonds are analysed directly (Scopes method). Conformational studies can also be performed under special conditions.
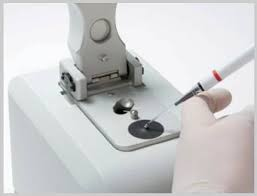
Visit the provider's website: http://inspired.aua.gr/instruct/
Basic Functions:
Photometry: Test Abs., Transmittance and Energy by fixed wavelength
Quantitative: Linear fit and Linear fit through zero two modes
Coefficient, Standard Sample input and Standard Sample read three modes to establish standard curve
Establish A=K1*C+K0, can search original data, graph curve, parameters settings
Can save 240 group curves, can test 240 data in each curve
Double wavelength, Triple wavelength test functions
Kinetics: Used for time course scanning or reaction rate calculations△A/t, can search all data.
Multi-Wavelength: Can test Transmittance and Abs. with 8 different wavelengths at most
Scanning: User can set the scan range from 190nm to 1100nm to test the max. Abs. peak value,
can do derivation, arithmetical operations to the graph.
Biology: DNA/Protein, (Optional: UV, Lowry, BCA, CBB and Biuret)
Professor Elias Eliopoulos is the Director of the Genetics Laboratory at the Biotechnology Department of the Agricultural University of Athens (A.U.A.) and leads the bioinformatics and structural biology group. He is professor of Biochemistry, a biophysicist and crystallographer by training with considerable experience in biomolecular structure analysis, epitope mapping of protein receptors, genetic polymorphisms and variation, cloning, with experimental and computational methods, protein structure prediction, ligand and drug design, protein design, in silico antibody design and biosoftware development. The group has experience and international reputation on computational protein folding, ab initio and homology modeling of proteins derived from edge gene research and membrane protein modeling. The group is also involved in many ligand computational design projects for pharmaceutical, medicinal and agricultural applications.
Basic Functions:
Photometry: Test Abs., Transmittance and Energy by fixed wavelength
Quantitative: Linear fit and Linear fit through zero two modes
Coefficient, Standard Sample input and Standard Sample read three modes to establish standard curve
Establish A=K1*C+K0, can search original data, graph curve, parameters settings
Can save 240 group curves, can test 240 data in each curve
Double wavelength, Triple wavelength test functions
Kinetics: Used for time course scanning or reaction rate calculations△A/t, can search all data.
Multi-Wavelength: Can test Transmittance and Abs. with 8 different wavelengths at most
Scanning: User can set the scan range from 190nm to 1100nm to test the max. Abs. peak value,
can do derivation, arithmetical operations to the graph.
Biology: DNA/Protein, (Optional: UV, Lowry, BCA, CBB and Biuret)